I have put up a link to the web map under the blog header. At the moment, it is just a base map different scale maps. All the maps used in the app so far are replica maps made by Thorfinn Tait.
Establishing a Base Map
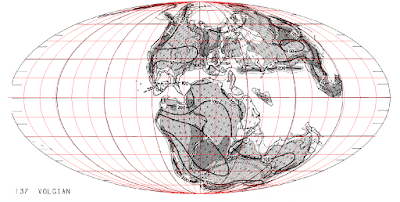
In a previous
post, I discussed how the basis for all the maps of Mystara can be referenced back to a paleogeographic map from the early 80s. With the goal of determining an accurate geographic location for all the maps and places of Mystara, the original paleo map had to be georeferenced. Most raster images must be georeferenced at some point, whether it be an old historical map, or satellite imagery. Georeferencing is a process in which a map is placed on a geographic grid based on some key control points. Generally, the more control points the better fit. In this case as the late Jurassic map most likely served as the basis for a tracing which was modified to the map of Mystara, it was important to use only two control points in order to scale and rotate the map to the right position. This same principle applied to the georeferencing of all the other Mystara maps also. the control points to establish the position of the late Jurassic map, and thus all other maps, were based on the latitude and longitude lines of the original map. as shown below it can be seen that this process resulted in some of the outer longitude lines not matching up perfectly with a digital dataset of longitude and latitude lines. A second georeferencing was done with more control points, resulting in a perfect match between the digital coordinates and the image, but this also resulted in a less perfect match between the world map of Mystara and the late Jurassic map, so the origianl scaled image shown below was used as a basis for all other maps.
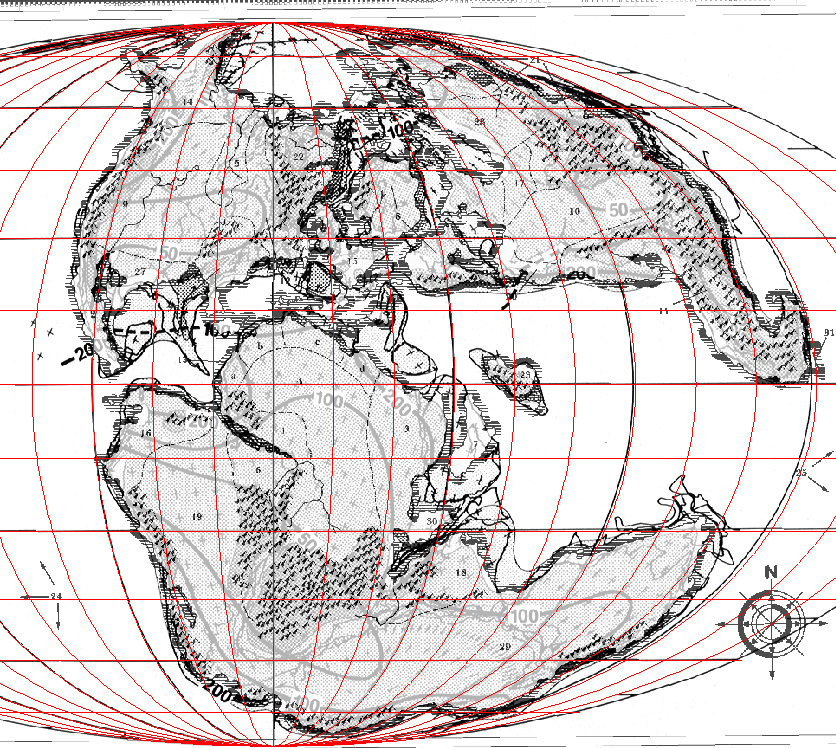
The world map of Mystara was georeferenced using the basis of the late Jurassic map. Control points used were points along the coastlines that were common to both maps. this resulted in a less than perfect match, so both points had to be moved until a best fit was found; the end result showing a comparison between the two can be seen below.
In order to fix the larger scale maps to this model accurately it was necessary to use a continental map from the D&D Dungeon Masters Companion: Book Two, which shows outlines of exactly how the larger scale hexagonal maps fit into the world map. A personal scanned copy of this map which had been matched to the world map using GIMP, was then georeferenced to the same location as the map pictured above. Based on the continental map, the map presented in X1: Isle of Dread was georeferenced.
At this point, colored version of the same maps already discussed were georeferenced, along with the 6 mile per hex(mph) map that appeared in the D&D expert rulebook published in 1981.
Moving the Base map to the Web
with a general base map is established, work can begin on the web application. The web map was built using
leaflet and
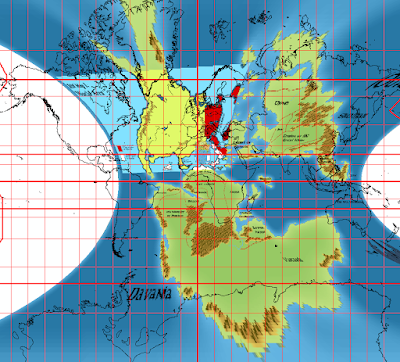
mapbox. After learning the basics of mapbox, each of the layers (the world map, continental map of Brun, 24mph known world map, and 6mph Karameikos map) established in ArcGIS was imported as a tile set into mapbox. While doing this, it was discovered that mapbox needed raster tile sets to be already established in the Web Mercator projection. If this was not done map box would either take a very long time to reproject the raster, or be unable to upload the raster entirely. Another issue that was encountered occurred when loading a raster formatted with a color map. when this raster was uploaded to mapbox the result was a greyscale image. To properly display color rasters in mapbox, all images must be in an 8-bit unsigned three color band format (three versions of the image in red, green, and blue). Thus, all the images were reprojected in the web Mercator projection and converted to a three-color band format. Once all four tile sets were uploaded they were added to a single style in map box, and opacity was adjusted for each image dependent on zoom level. below is a view of Mystara in the web Mercator format, and as expected, the poles are severely warped; outlines of current continents are shown for comparison.
With the base map hosted on map box it was fairly easy to port that over to a leaflet application.
This is the code so far. I put the map on a separate page on the blog which is linked underneath the header just as test to make sure it works. Next steps involve adding location markers and popups with data.


No comments:
Post a Comment